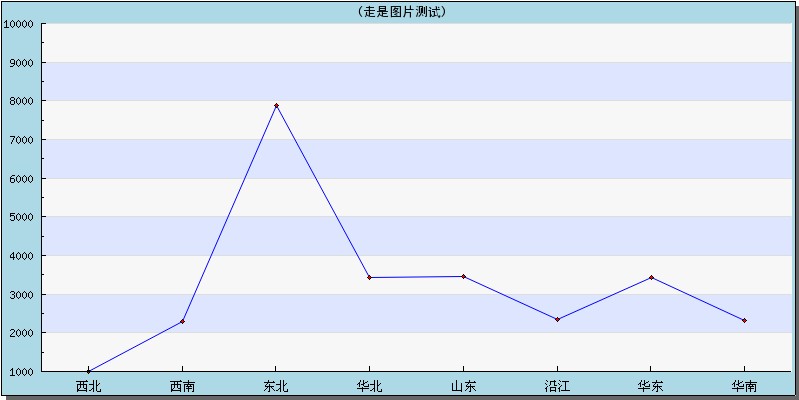
在使用帝国这么久,还没见过谁做过走势图,今天特意来弥补下。
<?php
$link=mysql_connect("localhost","root","123456");
mysql_select_db("数据库名",$link);
mysql_query("set names gb2312");
$sql=mysql_query("select * from 模型表名 order by newstime desc limit 1",$link);
$result=mysql_fetch_object($sql);
include ("jpgraph/jpgraph.php");
include ("jpgraph/jpgraph_line.php"); //引用折线图LinePlot类文件
$title=$result->title; //标题字段
$xibei=$result->xibei; //字段
$xinan=$result->xinan;
$dongbei=$result->dongbei;
$huabei=$result->huabei;
$shandong=$result->shandong;
$yanjiang=$result->yanjiang;
$huadong=$result->huadong;
$huanan=$result->huanan;
$datay = array($xibei,$xinan,$dongbei,$huabei,$shandong,$yanjiang,$huadong,$huanan); //填充的数据
$graph = new Graph(260,130,"auto"); //创建画布
$graph->img->SetMargin(40,10,10,30); //设置统计图所在画布的位置,左边距40、右边距10、上边距10、下边距30,单位为像素
$graph->img->SetAntiAliasing(); //设置折线的平滑状态
$graph->SetScale("textlin"); //设置刻度样式
$graph->SetShadow(); //创建画布阴影
$graph->title->Set("($title)"); //设置标题
$graph->title->SetFont(FF_SIMSUN,FS_BOLD); //设置标题字体
$graph->SetMarginColor("lightblue"); //设置画布的背景颜色为淡蓝色
$graph->yaxis->title->SetFont(FF_SIMSUN,FS_BOLD); //设置Y轴标题的字体
$graph->xaxis->SetPos("min");
$graph->yaxis->HideZeroLabel();
$graph->ygrid->SetFill(true,'#EFEFEF@0.5','#BBCCFF@0.5');
$a=array("西北","西南","东北","华北","山东","沿江","华东","华南"); //X轴
$graph->xaxis->SetTickLabels($a); //设置X轴
$graph->xaxis->SetFont(FF_SIMSUN); //设置X坐标轴的字体
$graph->yscale->SetGrace(20);
$p1 = new LinePlot($datay); //创建折线图对象
$p1->mark->SetType(MARK_FILLEDCIRCLE); //设置数据坐标点为圆形标记
$p1->mark->SetFillColor("red"); //设置填充的颜色
$p1->mark->SetWidth(2); //设置圆形标记的直径为4像素
$p1->SetColor("blue"); //设置折形颜色为蓝色
$p1->SetCenter(); //在X轴的各坐标点中心位置绘制折线
$graph->Add($p1); //在统计图上绘制折线
$graph->Stroke(); //输出图像
?>
在到要输出走势图的位置直接 <img src="[!--news.url--]e/picture/index.php">
演示地址:暂停
LinePlot类下载:
下载后,解压到e目录下面。
系统模型下载:暂停
最近看见好多人说不会用,如果不会用,可以直接眯我。QQ:6711729
上传以下图片:

|


 顶部
顶部  加入收藏夹
加入收藏夹